Data Analytics & RPA in Digital Marketing: Moving From Insights to Value
Marketing teams are sitting on more data than almost any other part of the business. Click-through rates, email opens, ad spend, website sessions, churn, customer lifetime value… it's all there. The problem is rarely a lack of data. The problem is getting from "we have a dashboard" to "we made a better decision because of it", and then not having to do the same manual reporting dance again next Monday.
I gave a breakfast talk on exactly this for IMM as part of their Friday Flash Talk series. The theme was simple: moving from insights to value. Data analytics gets you the insight. Process automation gets the repetitive work out of the way so that someone actually has time to act on it. Here's the written version.
What counts as "marketing data"?
Before we talk about tools, it helps to be honest about what we're actually trying to measure. I group marketing analytics into a handful of buckets:
- Audience and customer insights: demographics, psychographics and behaviour
- Engagement and content performance: CTR, social media and email metrics
- Customer value and retention: loyalty, CLV and churn rate
- Sales and revenue impact: what marketing actually did for sales and ROI
- Website and platform analytics: traffic, engagement and conversion rates
- Paid advertising metrics: CPC, CPA and ROAS
- Market and competitor data: trends and competitor strategies
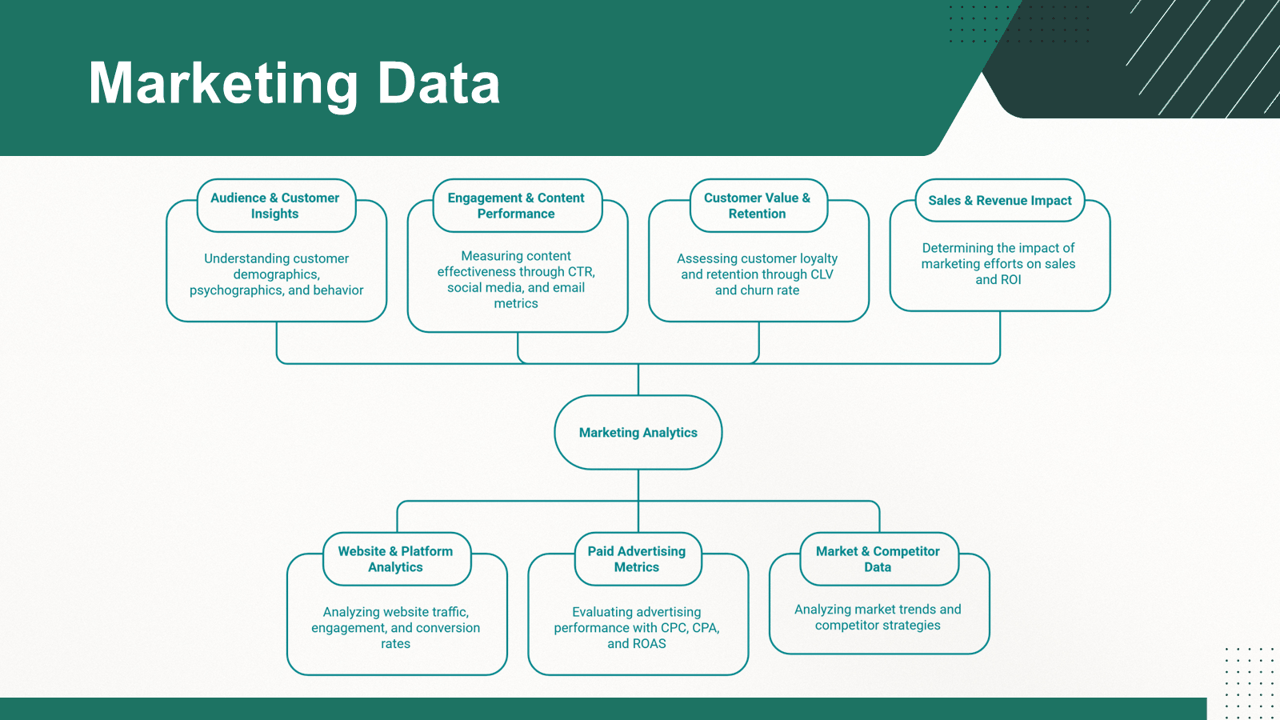
The different streams of data that feed into marketing analytics.
If you can't say which of these buckets a report belongs to, that report probably isn't answering a question anyone asked.
The data lifecycle: from raw collection to a decision
Every useful insight goes through the same journey, whether you do it in Excel at 11pm or in a proper BI platform: collect → clean → store → transform → model → analyse → visualise → decide.
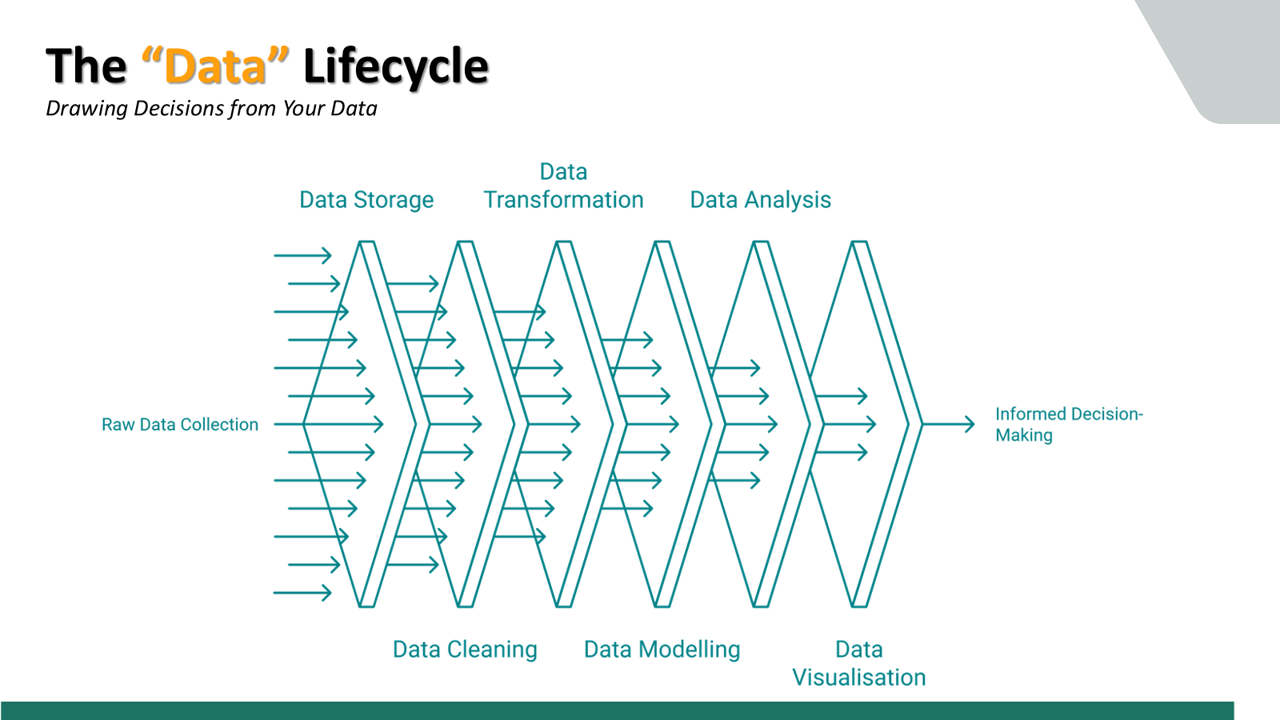
Each stage filters and shapes the data a little more until it's fit to support a decision.
A few stages deserve special attention because they're where marketing data usually goes wrong:
Collection. Your data will come in three flavours: structured (tables, easy to manage), unstructured (free-form content like reviews, comments and emails, which needs more advanced tools) and semi-structured (somewhere in between). You'll also be collecting both qualitative data, which helps you understand opinions and motivations, and quantitative data, which you use for measurement and testing hypotheses. You need both.
Cleaning. Profile the data, remove duplicates, handle missing values, standardise formats, validate data types, fix inconsistencies and remove anything irrelevant. It's the least glamorous step and the one that decides whether anyone trusts your numbers.
Transformation. Standardise dates and currencies, aggregate rows (e.g. total sales per region), pivot, join data from different sources, derive new fields (FullName from FirstName + LastName) and bucket continuous values (age 18–25 = "Youth"). Then decide whether you're doing ETL (transform before loading, the traditional BI approach) or ELT (load into a warehouse first and transform there, which tends to be faster with cloud systems).
Modelling. Entities, attributes, primary and foreign keys, and relationships, like one Customer having many Orders. Normalising your data and getting your joins right is what makes everything downstream (especially your visuals) behave.
Asking the right questions
Data analysis isn't one activity. It's a sequence of questions, and each type of analysis answers a different one:
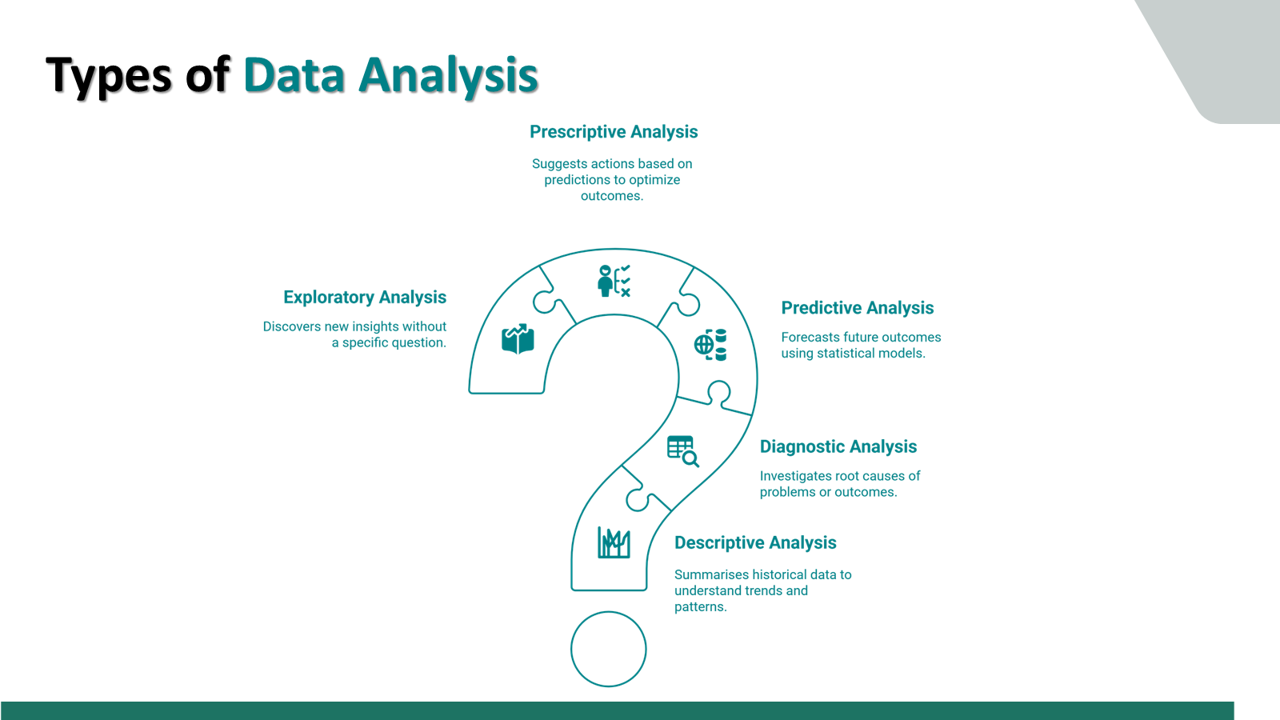
From descriptive ("what happened?") all the way to prescriptive ("what should we do about it?").
- Descriptive: what happened? It summarises historical data to show trends.
- Diagnostic: why did it happen? It investigates root causes.
- Exploratory: what are we not seeing? It finds new insights without a specific question.
- Predictive: what might happen next? It forecasts outcomes using statistical models.
- Prescriptive: what should we do about it? It suggests actions based on those predictions.
Most marketing reporting never leaves "descriptive". The value is further up the question mark.
Pick the right visual (please)
Once the data is clean and modelled, the visual you choose decides whether anyone understands it. My cheat sheet:
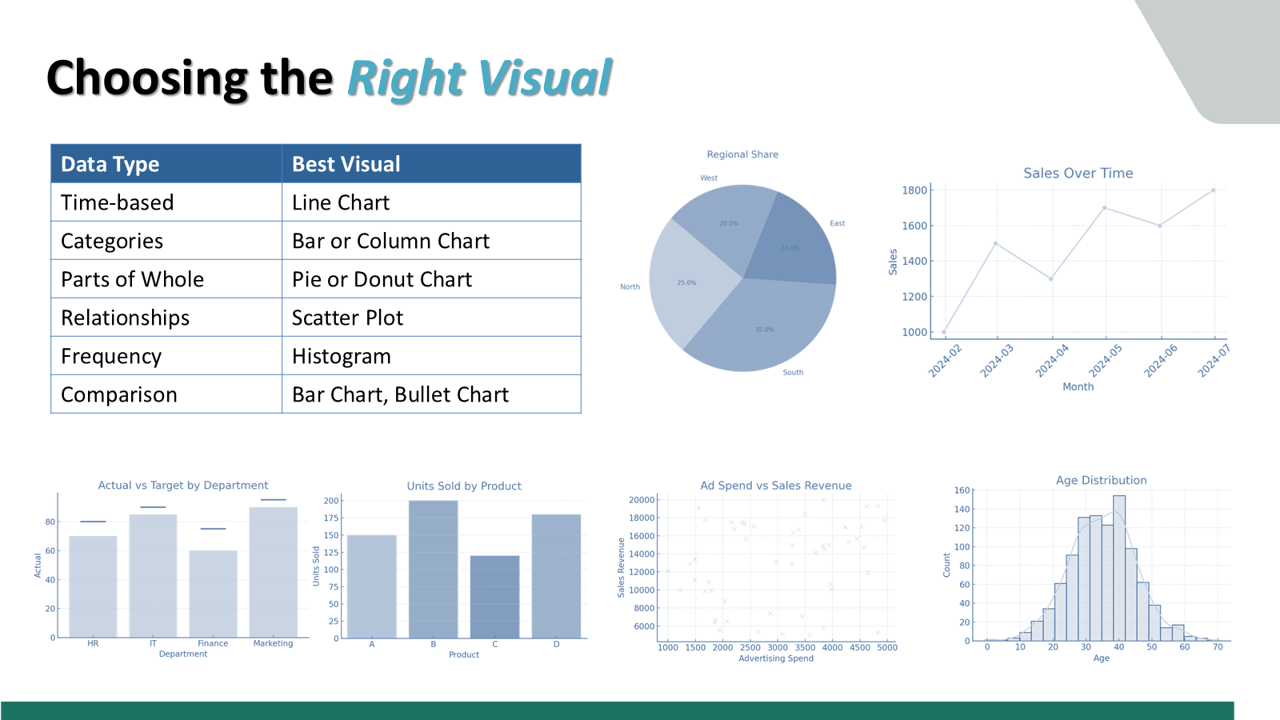
Match the visual to the shape of the data, not to what looks nice.
Line charts for anything over time, bar or column charts for categories, pie or donut charts for parts of a whole (sparingly!), scatter plots for relationships, histograms for frequency, and KPI cards for the one or two numbers people need at a glance. In the talk we then walked through Power BI (Desktop, Service and Mobile), which gives you a single source of truth instead of fifteen versions of the same spreadsheet.
One more thing on governance: in South Africa, POPIA requires lawful processing and protection of personal data, and marketing data is full of personal information. Poor governance leads to reputational damage, regulatory fines and business disruption. Build it in from the start.
Where process automation comes in
Insights are only half the story. Somebody still has to download the ad report, paste it into the master spreadsheet, send the weekly summary and chase the missing numbers. That's where process automation earns its keep: enhancing efficiency, automating repetitive tasks, reducing manual effort and streamlining operations.
The three types I spoke about were:
- Robotic Process Automation (RPA): mimicking human tasks and executing them the same way a human would
- Business Process Automation: optimising business processes to run more efficiently
- Agentic AI: using AI and agents to run processes, with the focus on making the agent a part of the workforce
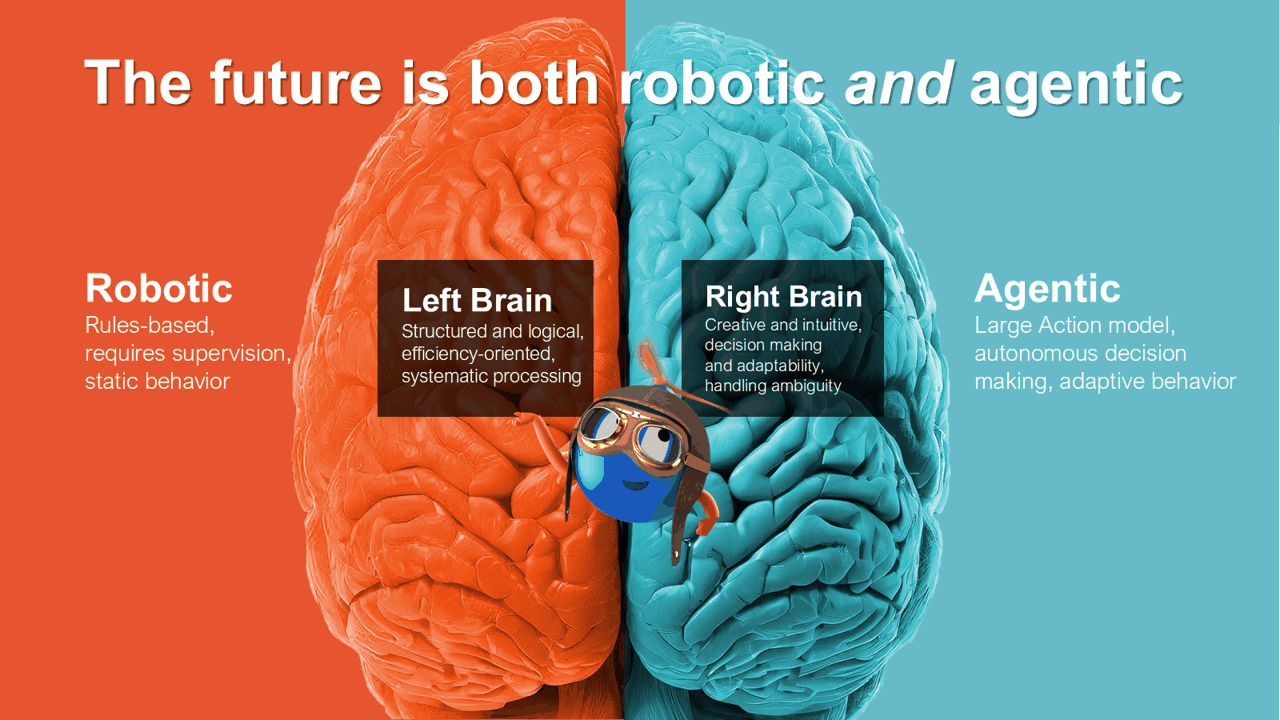
Robotic automation is the structured "left brain"; agentic automation is the adaptive "right brain". You need both.
Daniel Dines from UiPath has a lovely analogy for this. Getting a glass of water from your own fridge in the middle of the night is basically RPA: a routine set of steps you can do half asleep. Doing the same thing in a hotel room is agentic: you're still using the same basic routines (walk, open fridge, find bottle), but you have to adapt them to an unfamiliar environment. RPA is brilliant for predictable, rule-based work. Agents are for the variations and exceptions. The future is both.
Measuring the value (not just the hours)
When people calculate the benefit of automation they usually stop at "hours saved". That's the first layer. In the talk I unpacked it further:
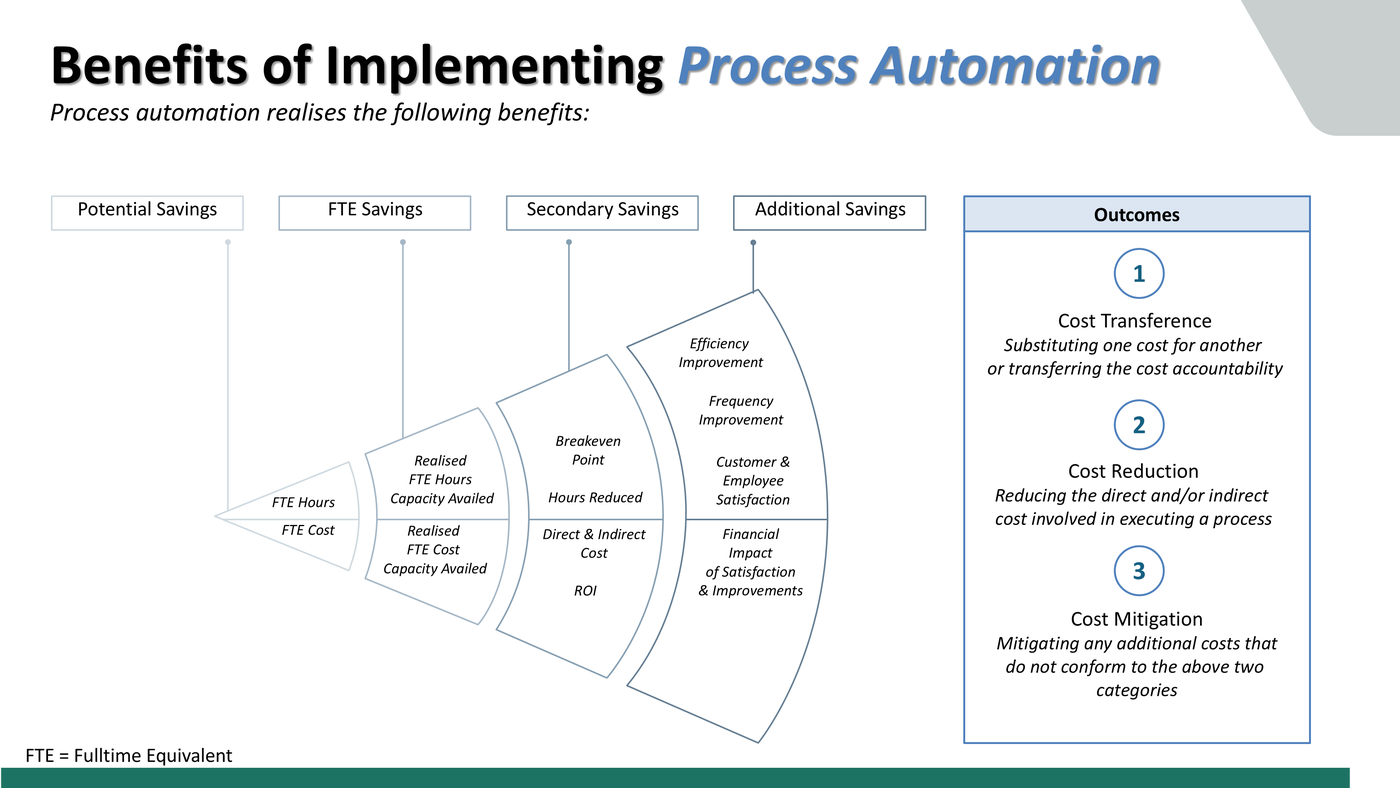
Savings build up in layers, from FTE hours to secondary and additional savings, and they lead to three types of outcome.
- FTE savings: hours and cost, realised versus capacity availed
- Secondary savings: breakeven point, hours reduced, direct and indirect cost, ROI
- Additional savings: efficiency and frequency improvements, customer and employee satisfaction, and the financial impact of those improvements
Those then land as one of three outcomes: cost transference (substituting one cost for another, or shifting accountability), cost reduction (cutting the direct or indirect cost of running a process) or cost mitigation (avoiding costs that don't fit either of the other two).
Why this matters now
A few numbers from the talk that show where things are heading:
- 75% of knowledge workers already use AI at work, according to the Microsoft and LinkedIn 2024 Work Trend Index. Employees aren't waiting for permission.
- 65% of organisations were using generative AI in at least one business function in 2024, according to the McKinsey Global Survey on AI.
- 70% of generative AI high performers said data was a challenge in capturing value from the technology (same McKinsey survey).
That last one is my favourite, because it brings us right back to the start. AI and automation are only as good as the data you feed them.
Getting started
If you're in marketing and this all feels like a lot, start small:
- Learn the toolset. Power BI and Power Automate are great starting points, and UiPath Academy and Microsoft Learn are both free.
- Identify your pain points. Which report do you rebuild by hand every week?
- Start small. Automate one task you do often to build up experience.
- Collaborate with IT so it scales and is properly governed.
- Shift your mindset. Solving the problem matters more than knowing how to code.
Data tells you what's happening. Automation gives you the time to do something about it. Put them together and you get from insights to value much faster.