Level of Difficulty: Beginner – Senior.

Often we create Power BI reports that require some sort of filtering mechanism but filters take up a lot of real-estate that could be used for other visuals instead. What if we could hide and show a filter pane using a “hamburger” menu mechanism?
We can and here’s how.
What are the steps?
The steps to using a hamburger menu to hide and show a filter pane in Power BI are:
- Create the report layout and set up the filters
- Add two hamburger menu images
- Create a “hide” bookmark
- Create a “show” bookmark
- Add the bookmarks to the actions of each image
- Align the two images
Create the report layout and set up the filters
To create the filters panel, add a rectangle (Home > Insert > Shapes) before adding and aligning the filter visuals on top of the rectangle.
An example would be something like this:

Add two hamburger menu images
Next we would want to add two hamburger menu icons (preferably SVG or PNG images with transparent backgrounds) next to one another (Home > Insert > Image).

Create a hide bookmark
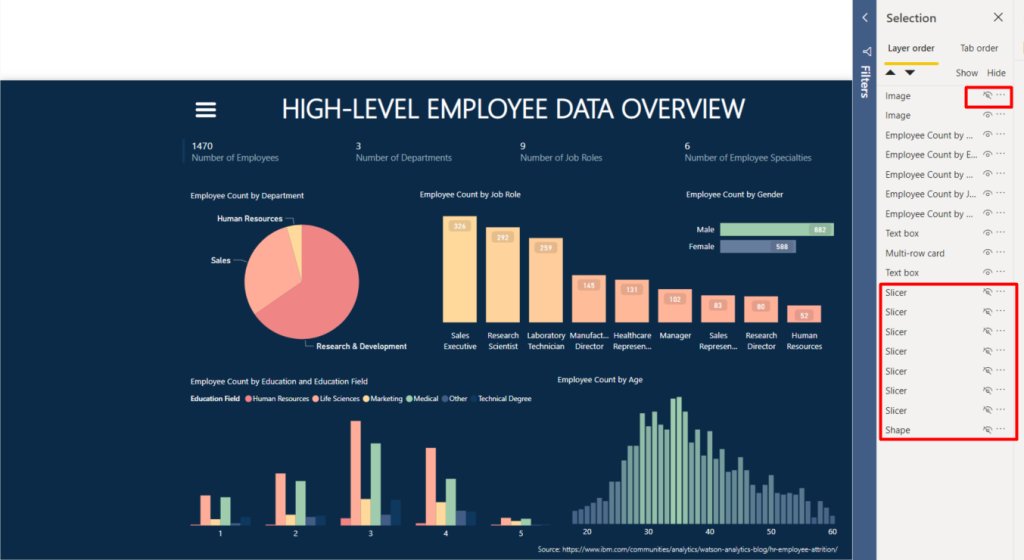
In order to create a bookmark, you would need to ensure that the bookmark pane and selection pane are visible. You can do this by navigating to the View tab and ensuring that the Bookmarks Pane and the Selection Pane are both checked. This should allow you to see the following:

To create a hide bookmark you would need to hide all of the filters, the rectangle block and one of the hamburger menu images using the Selection Pane. To hide a visual (or an element), you can either click on the eye icon next to the visual in the selection pane or you can click on the element on the report and select hide on the selection pane.
Once all necessary visuals have been hidden, you should see this:
Next, you are going to want to bookmark the view that you are currently looking at by selecting “Add” in the Bookmarks Pane. This will result in “Bookmark 1” being created:
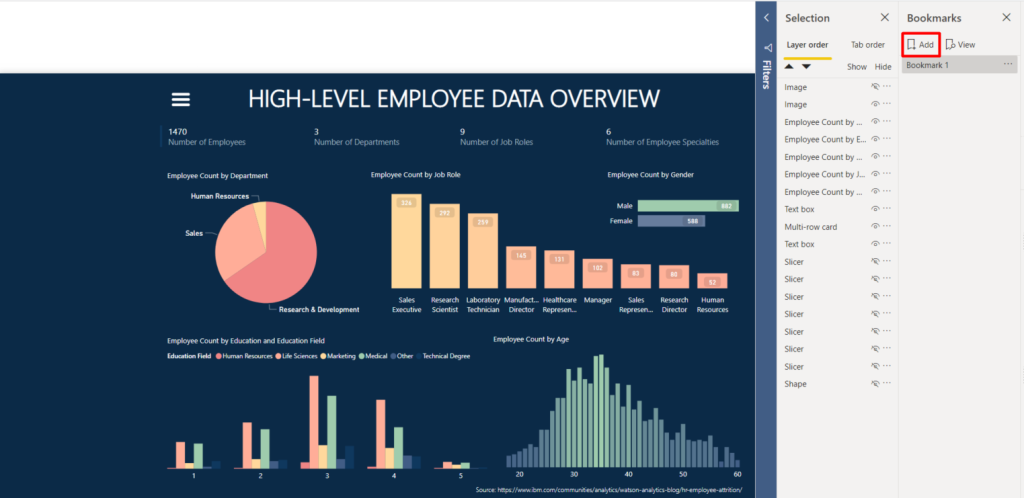
You can then rename the bookmark to “Hide Filters” by double clicking on the bookmark or by selecting the three dots next to the bookmark name (on the right) and selecting Rename:

Create a show bookmark
To create a “Show” bookmark, we are going to ensure that all of our filters are visible again:

Next we are going to hide the hamburger image that was visible in the “Hide” bookmark:

Then select “Add” in the Bookmark Pane and rename the bookmark to “Show Filters“:

Adding the bookmarks to the actions of each image
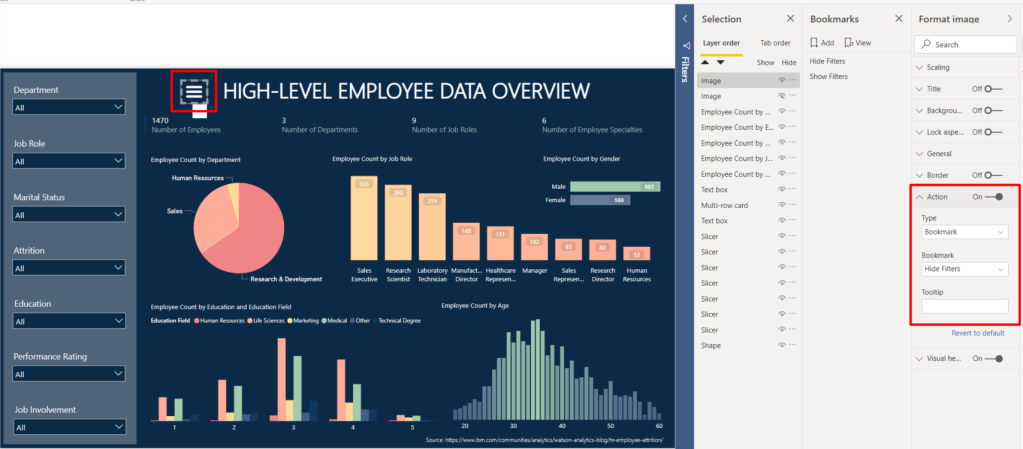
Now we need to add these bookmarks as actions to the correct hamburger image. Let’s start with the image that’s still visible. When we click that image, we are expecting our filters to Hide. So we want to link this image to the “Hide Filters” bookmark.
To do this, click on the image, navigate to the Format Image pane, ensure that Action is On (if it is Off, click on the round dot and it will turn on), expand Action, change Type to “Bookmark” and select the “Hide Filters” bookmark:
If you hover over the visible image, there should be a tool tip that appears:
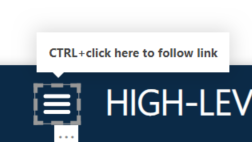
If you hold Ctrl and click on the image, it will apply the bookmark and the filters (with its hamburger menu image) should disappear.
Now let’s repeat these steps for the image that is currently visible and assign the “Show Filters” bookmark to its Action:

Now you can lay the one hamburger image on top of the other the other so that they appear to be one image (you may need both images to be visible for this). Reorganise your report layout and play around with the other fancy things that you can do with bookmarks!
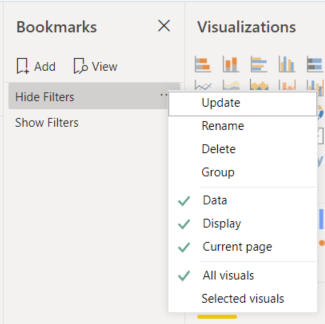
Just a note: It is possible to keep values of filters between bookmarks. It would require manipulation of bookmark properties. For this scenario, the data option would need to be deselected:
This report is available on GitHub, here.
If you got stuck or have feedback, please feel free to drop a comment below or reach out to jacqui.jm77@gmail.com for help!

Excellent items from you, man. I’ve take into account your
stuff previous to and you’re simply too wonderful. I
actually like what you have acquired here, really like what you are stating and the way in which during which you are saying it.
You make it entertaining and you still take care of to keep it smart.
I can’t wait to read far more from you. That is really a great web site.
LikeLike
Thank you very much! I really appreciate your feedback
LikeLike